


Data Warehousing: The Core of Data Analytics
Microsoft Fabric Data Warehouse is a comprehensive platform encompassing data, analytics, and AI (Artificial Intelligence). It revolves around the process of storing, organizing, and managing vast volumes of structured and semi-structured data, forming the foundation for data-driven decision-making.
To learn more about Data Warehousing, refer to the relevant documentation.
https://learn.microsoft.com/en-us/fabric/data-warehouse/
Fabric Data Warehouse: Powered by Synapse Analytics
Fabric’s data warehouse leverages the capabilities of Synapse Analytics, offering a rich set of features that streamline data management and analysis. It boasts advanced query processing capabilities and supports the full spectrum of transactional T-SQL functionalities typically found in enterprise data warehouses.
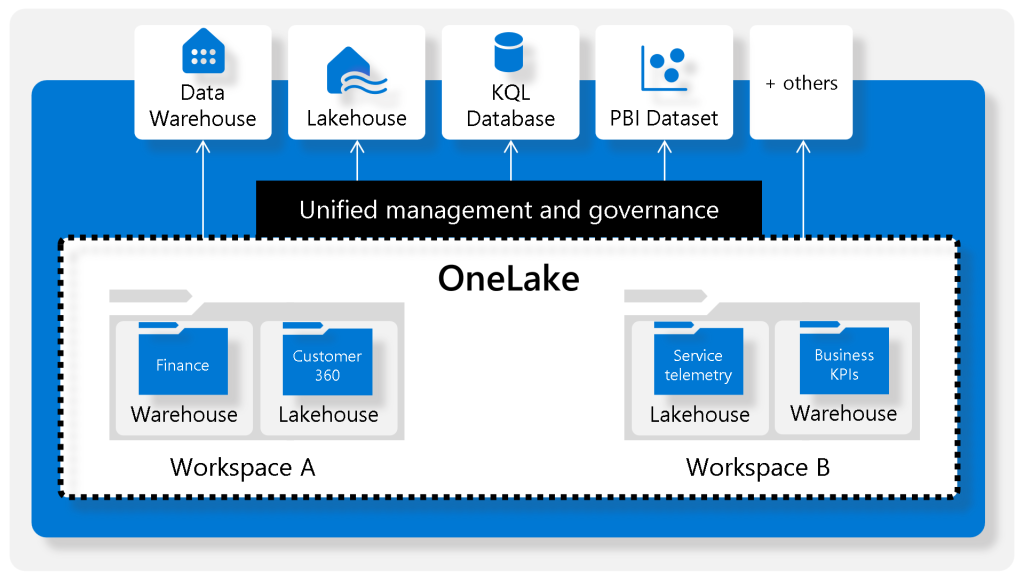
Single Data Lake Focus
Unlike a dedicated SQL pool in Synapse Analytics, a warehouse in Microsoft Fabric centers around a single data lake. Data within the Fabric warehouse is stored in the efficient Parquet file format. This architecture allows users to concentrate on tasks like data preparation, analysis, and reporting, while harnessing the extensive capabilities of the SQL engine. Your data remains uniquely stored within Microsoft OneLake.
To learn more about Microsoft OneLake, refer to the relevant documentation.
https://learn.microsoft.com/en-us/fabric/onelake/onelake-overview

Understanding the ETL Process
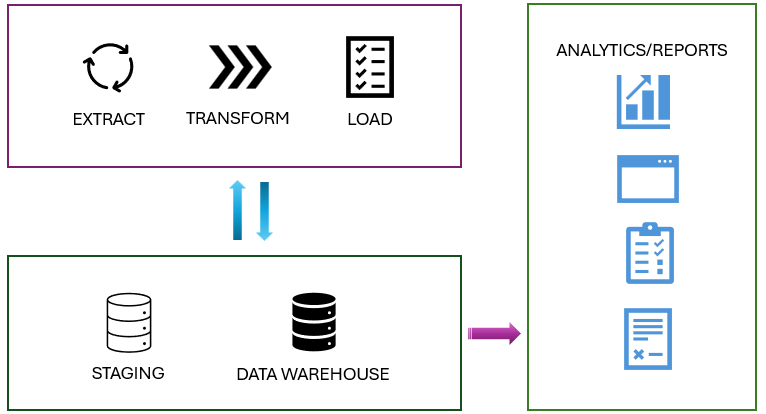
ETL (Extract, Transform, and Load) forms the backbone of data analytics and data warehouse workflows. Let’s review some key aspects of data manipulation within an ETL process.
- Data Extraction: Connecting to the source system and gathering the necessary data for analytical processing.
- Data Transformation: Applying a series of steps to the extracted data to convert it into a standardized format. This includes combining data from multiple tables, cleaning data, deduplicating data, and performing data validations.
- Data Loading: Loading the extracted and transformed data into the fact and dimension tables. In an incremental load scenario, this involves periodically applying ongoing changes as needed. This process often necessitates reformatting the data to ensure its quality and compatibility with the data warehouse schema.
- Post-Load Optimizations: Once the data is loaded, performing optimizations like updating indexes and table distribution statistics to enhance data warehouse performance.
Export to Sheets
These ETL steps can run in parallel depending on the scenario. Data is loaded as soon as it’s ready, without waiting for preceding steps to finish, contributing to overall efficiency.
Load Data into a Microsoft Fabric Data Warehouse
The ETL Foundation
Microsoft Fabric Data Warehouse is a comprehensive platform encompassing data, analytics, and AI (Artificial Intelligence). It centers around the process of storing, organizing, and managing large volumes of structured and semi-structured data.
Fabric’s data warehouse is powered by Synapse Analytics, offering a rich feature set that simplifies data management and analysis. It includes advanced query processing capabilities and supports the full spectrum of transactional T-SQL capabilities found in enterprise data warehouses.
Unlike a dedicated SQL pool in Synapse Analytics, a warehouse in Microsoft Fabric is centered around a single data lake. The data in the Microsoft Fabric warehouse is stored in the Parquet file format. This setup allows users to focus on tasks such as data preparation, analysis, and reporting. It takes advantage of the SQL engine’s extensive capabilities, where a unique copy of their data is stored in Microsoft OneLake.
Understand Data Ingestion and Data Load Operations
While both processes are integral to the ETL (Extract, Transform, Load) pipeline in a data warehouse scenario, they serve distinct purposes.
- Data ingestion/extraction involves moving raw data from various sources into a central repository.
- Data loading entails taking the transformed or processed data and loading it into the final storage destination for analysis and reporting.
All Fabric data items, such as data warehouses and lakehouses, automatically store their data in OneLake using the Delta Parquet format.
Stage Your Data
You might need to build and work with auxiliary objects like tables, stored procedures, and functions during a load operation. These objects are commonly referred to as staging. Staging objects act as temporary storage and transformation areas. They can either share resources with a data warehouse or reside in their own dedicated storage area.
Staging serves as an abstraction layer, simplifying and streamlining the load operation into the final tables of the data warehouse. Additionally, the staging area provides a buffer to minimize the load operation’s impact on data warehouse performance. This is crucial in environments where the data warehouse must remain operational and responsive during data loading.

Review Types of Data Loads
There are two primary types of data loads to consider when loading a data warehouse.
| Load Type | Description | Operation | Duration | Complexity | Best Used |
|---|---|---|---|---|---|
| Full (Initial) Load | The process of populating the data warehouse for the first time. | All tables are truncated and reloaded, discarding old data. | May take longer due to the volume of data being handled. | Easier to implement as there’s no history to preserve. | Typically used when setting up a new data warehouse or when a complete data refresh is necessary. |
| Incremental Load | The process of updating the data warehouse with changes since the last update. | History is preserved, and tables are updated with new information. | Generally faster than the initial load. | More complex due to the need to track changes in the source data since the last load. | Commonly used for regular updates to the data warehouse, such as daily or hourly updates. Requires mechanisms like Change Data Capture (CDC), change tracking, or triggers to identify changes in source systems. |
An ETL process for a data warehouse doesn’t always require both full and incremental loads. Sometimes, a combination is employed. The choice depends on factors like data volume, characteristics, and data warehouse requirements.
To learn more about incremental loads, refer to the relevant documentation.
https://learn.microsoft.com/en-us/fabric/data-factory/tutorial-incremental-copy-data-warehouse-lakehouse
Load a Dimension Table
Consider dimension tables as the “who, what, where, when, why” of your data warehouse. They provide descriptive context for the raw numbers stored in fact tables.
For example, in an online store, your fact table might hold raw sales data (units sold per product). Dimension tables would add context by specifying who bought the products, when, and where.
Slowly Changing Dimensions (SCD)
Slowly Changing Dimensions evolve over time, but gradually and unpredictably. A customer’s address in a retail business is a prime example. When a customer moves, their address changes. Overwriting the old address with the new one erases history. However, analyzing historical sales data might require knowing the customer’s location at the time of each sale. SCDs address this challenge.
Several types of SCDs exist, with Type 1 and Type 2 being the most common.
- Type 0: Dimension attributes remain constant.
- Type 1: Overwrites existing data, discarding history.
- Type 2: Adds new records for changes, preserving full history for a given natural key.
- Type 3: History is added as a new column.
- Type 4: A new dimension is created.
- Type 5: Used when specific attributes of a large dimension change over time, but Type 2 is impractical due to the dimension’s size.
- Type 6: Combines Type 2 and Type 3 approaches.
In Type 2 SCD, when a new version of the same element enters the data warehouse, the old version is marked as expired, and the new one becomes active.
Load a Fact Table
Let’s consider loading a Fact_Sales table in a data warehouse. This table contains sales transactions with columns like FactKey, DateKey, ProductKey, OrderID, Quantity, Price, and LoadTime.
Assume a source table Order_Detail in an OLTP system with columns: OrderID, OrderDate, ProductID, Quantity, and Price.
The following T-SQL script exemplifies loading the Fact_Sales table:
-- Lookup keys in dimension tables
INSERT INTO Fact_Sales (DateKey, ProductKey, OrderID, Quantity, Price, LoadTime)
SELECT d.DateKey, p.ProductKey, o.OrderID, o.Quantity, o.Price, GETDATE()
FROM Order_Detail o
JOIN Dim_Date d ON o.OrderDate = d.Date
JOIN Dim_Product p ON o.ProductID = p.ProductID;
This example uses JOIN operations to retrieve DateKey and ProductKey values from Dim_Date and Dim_Product, respectively, before inserting data into Fact_Sales. The loading process’s complexity can vary based on factors like data volume, transformation needs, error handling, schema differences, and performance requirements.
By understanding these data loading strategies and considerations, you can efficiently populate your Fabric data warehouse and lay the groundwork for insightful analytics.
Use data pipelines to load a warehouse
Integrated Data Ingestion
Microsoft Fabric’s Warehouse offers integrated data ingestion tools, empowering users to load and ingest data into warehouses at scale through both coding and non-coding experiences.
Data Pipelines: The Backbone of Data Integration
Data pipelines are cloud-based services designed for data integration. They enable the creation of workflows that orchestrate data movement and transformation at scale. You can create and schedule data pipelines to ingest and load data from diverse data stores. Additionally, you can construct complex ETL (Extract, Transform, Load) or ELT (Extract, Load, Transform) processes that visually transform data using data flows.
Leveraging Azure Data Factory Functionality
Much of the functionality of data pipelines in Microsoft Fabric stems from Azure Data Factory, allowing for seamless integration and utilization of its features within the Microsoft Fabric ecosystem.
Note: All data within a Warehouse is automatically stored in the Delta Parquet format in OneLake.
Creating a Data Pipeline
There are multiple ways to launch the data pipeline editor:
- From the workspace: Select
+ New, thenData pipeline. If it’s not immediately visible, selectMore optionsand locateData pipelineunder theData Factorysection.

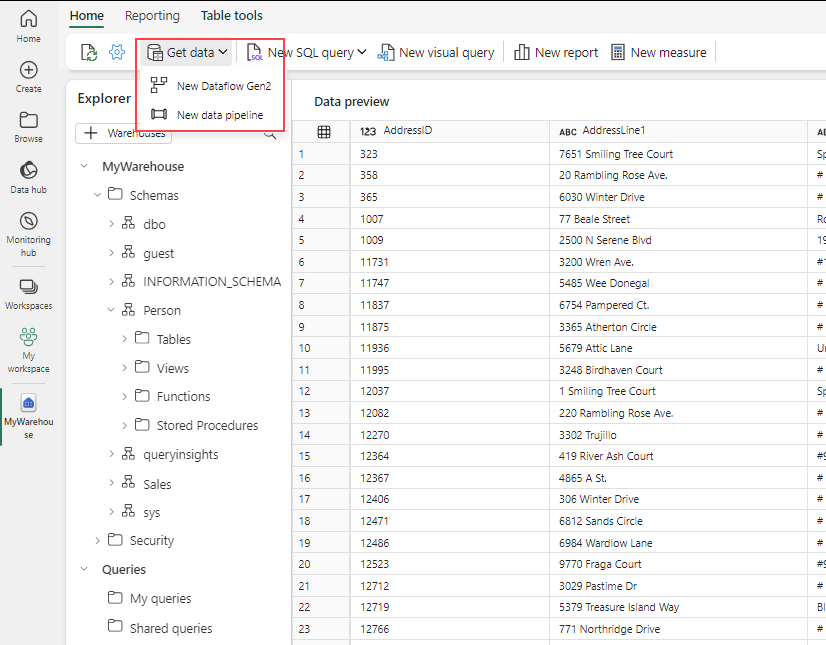
- From the warehouse asset: Select
Get Data, thenNew data pipeline.

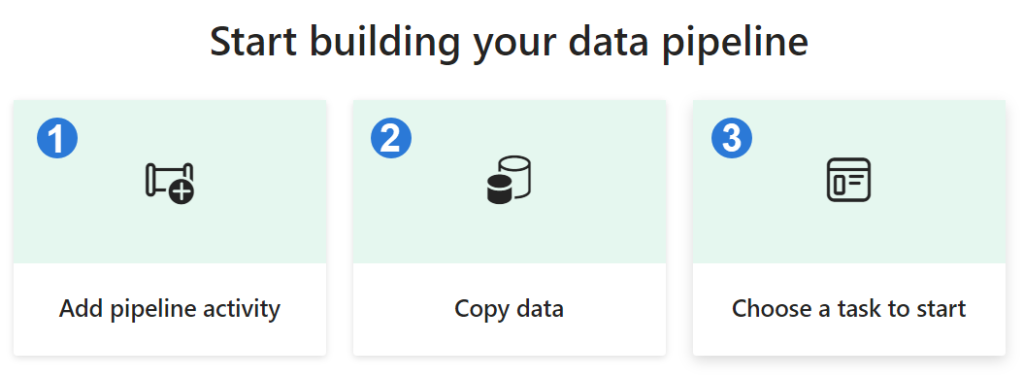
Once in the editor, you have three options for creating a pipeline:
1. Add pipeline activity: Launches the pipeline editor where you can manually create your own pipeline by adding and configuring activities.
2. Copy data: Launches an assistant to guide you through copying data from various data sources to a specified destination. A new pipeline activity with a preconfigured Copy Data task is generated upon completion.
3. Choose a task to start: Offers a collection of predefined templates to assist you in initiating pipelines based on various common scenarios.

Configuring the Copy Data Assistant
The copy data assistant provides a step-by-step interface to simplify the configuration of a Copy Data task:

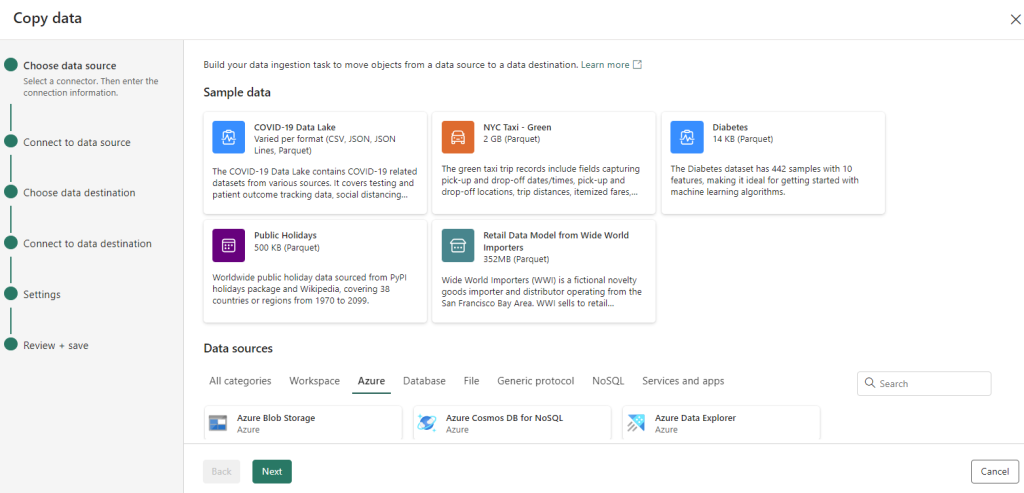
- Choose data source: Select a connector and provide the necessary connection details.
- Connect to a data source: Select, preview, and choose the data. You can select from tables or views, or provide your own custom query.
- Choose data destination: Select the target data store.
- Connect to data destination: Select and map columns from the source to the destination. You can load data into a new or existing table.
- Settings: Configure additional settings such as staging and default values.
After copying the data, you can utilize other tasks for further transformation and analysis. The Copy Data task can also be used to publish transformation and analysis results for consumption by business intelligence (BI) tools and applications.
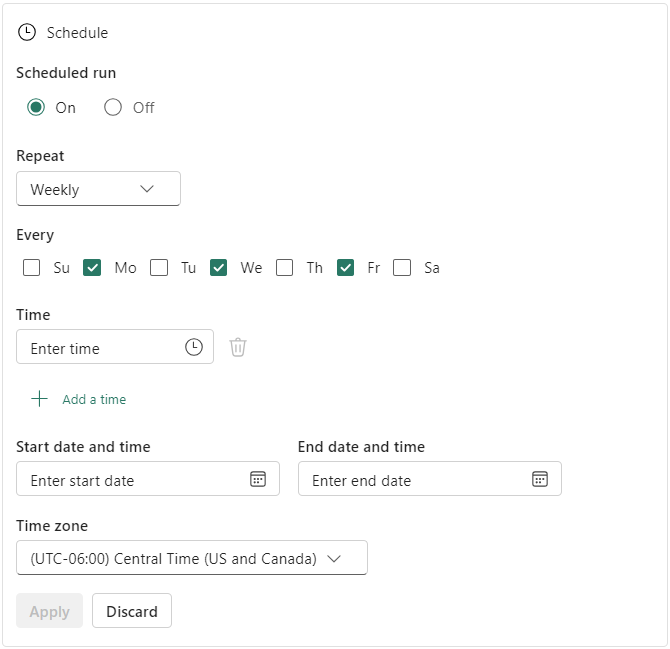
Scheduling a Data Pipeline
You can schedule your data pipeline by selecting Schedule from the data pipeline editor or by configuring the schedule in the Settings within the Home menu of the editor.


Recommendation
Data pipelines are recommended for a code-free or low-code experience due to their graphical user interface. They are ideal for data workflows that run on a schedule or connect to multiple data sources.
To learn more about data pipelines, refer to the Microsoft documentation on “Ingest data into your Warehouse using data pipelines.”
https://learn.microsoft.com/en-us/fabric/data-warehouse/ingest-data-pipelines
Load Data using T-SQL
SQL Developers’ Advantage
SQL developers and citizen developers, who are often proficient in the SQL engine and T-SQL, will find the Warehouse in Microsoft Fabric particularly advantageous.
This is due to the Warehouse being powered by the same SQL engine they are familiar with, enabling them to execute complex queries and data manipulations effortlessly. These operations include filtering, sorting, aggregating, and joining data from different tables. The SQL engine’s extensive range of functions and operators further empowers sophisticated data analysis and transformations directly within the database.
Use the COPY Statement
The COPY statement serves as the primary method for importing data into the Warehouse. It enables efficient data ingestion from an external Azure storage account.
This statement offers flexibility by allowing you to:
- Specify the format of the source file (currently supports PARQUET and CSV).
- Designate a location to store rows rejected during the import process.
- Skip header rows.
- Configure other options to tailor the import process.
The ability to store rejected rows separately is invaluable for data cleaning and quality control, allowing you to easily identify and investigate any issues with data that couldn’t be imported successfully.
To establish a connection to an Azure storage account, you’ll need to use either a Shared Access Signature (SAS) or a Storage Account Key (SAK).
Handle Errors
The option to specify a different storage account for the ERRORFILE location (REJECTED_ROW_LOCATION) enhances error handling and debugging. This makes it easier to isolate and investigate any problems that arise during data loading. Note that ERRORFILE is applicable only to CSV files.
Load Multiple Files
The COPY statement’s support for wildcards and multiple files in the storage location path allows for efficient bulk data loading. This is especially useful when dealing with large datasets spread across multiple files.
You can specify multiple file locations from the same storage account and container using a comma-separated list.
COPY my_table
FROM 'https://myaccount.blob.core.windows.net/myblobcontainer/folder0/*.csv,
    https://myaccount.blob.core.windows.net/myblobcontainer/folder1/'
WITH (
    FILE_TYPE = 'CSV',
    CREDENTIAL=(IDENTITY= 'Shared Access Signature', SECRET='<Your_SAS_Token>')
    FIELDTERMINATOR = '|'
)
Here’s an example of loading a PARQUET file:
COPY INTO test_parquet
FROM 'https://myaccount.blob.core.windows.net/myblobcontainer/folder1/*.parquet'
WITH (
    CREDENTIAL=(IDENTITY= 'Shared Access Signature', SECRET='<Your_SAS_Token>')
)
Ensure that all files share the same structure (identical columns in the same order) and that this structure matches the target table’s structure.
Load Tables from Other Warehouses and Lakehouses
You can load data from various data assets within a workspace, such as other warehouses and lakehouses. To reference these assets, use three-part naming to combine data from tables across them. You can then employ CREATE TABLE AS SELECT (CTAS) and INSERT...SELECT to load the data into the warehouse.
| SQL Statement | Description |
|---|---|
CREATE TABLE AS SELECT | Creates a new table based on the output of a SELECT statement. Often used for creating table copies or transforming and loading results from complex queries. |
INSERT...SELECT | Inserts data from one table into another. Useful for copying data between tables without creating a new one. |
This feature allows analysts to combine data from a warehouse and a lakehouse, loading the combined data into the warehouse for further analysis. It’s particularly beneficial when data is distributed across multiple assets within a workspace.
The following query creates a new table in the analysis_warehouse that combines data from the sales_warehouse and the social_lakehouse using the product_id as the common key. The new table can then be used for further analysis.
CREATE TABLE [analysis_warehouse].[dbo].[combined_data]
AS
SELECT
FROM [sales_warehouse].[dbo].[sales_data] sales
INNER JOIN [social_lakehouse].[dbo].[social_data] social
ON sales.[product_id] = social.[product_id];
Cross-Database Querying
All Warehouses sharing the same workspace are integrated into a single logical SQL server. When using SQL client tools like SQL Server Management Studio, you can easily perform cross-database queries, similar to any SQL Server instance.

If you’re using the object explorer from the workspace to query your Warehouses, you need to add them explicitly. The added warehouses will also be visible in the Visual query editor.

Conclusion
In Microsoft Fabric, T-SQL empowers you to efficiently load data into a warehouse using the COPY statement or by seamlessly accessing data from other warehouses and lakehouses within the same workspace. This streamlines data management and analysis, enabling you to focus on extracting valuable insights.
Load and Transform Data with Dataflow Gen2
A New Generation of Dataflows
Dataflow Gen2 represents the latest evolution of dataflows, offering a comprehensive Power Query experience that guides you through each step of importing data. The process of creating dataflows has been streamlined, reducing the number of steps involved.
Dataflows find applications in various scenarios within Microsoft Fabric:
- Data pipelines: Ingest data into a lakehouse or warehouse.
- Power BI reports: Define datasets for report creation.
Creating a Dataflow
To create a new dataflow, navigate to your workspace and select + New. If Dataflow Gen2 isn’t readily visible, click on More options and locate it under the Data Factory section.

Importing Data
Once the Dataflow Gen2 editor launches, you have numerous options for loading your data.

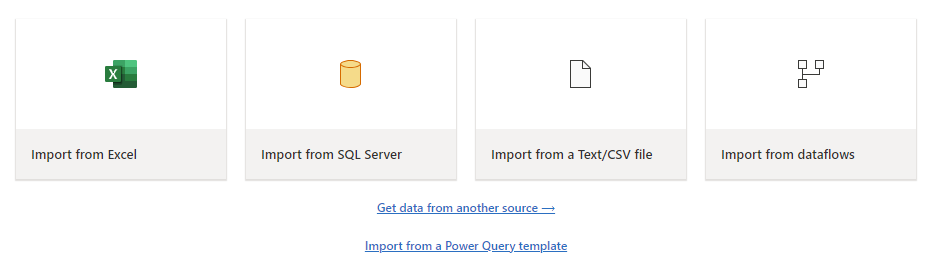
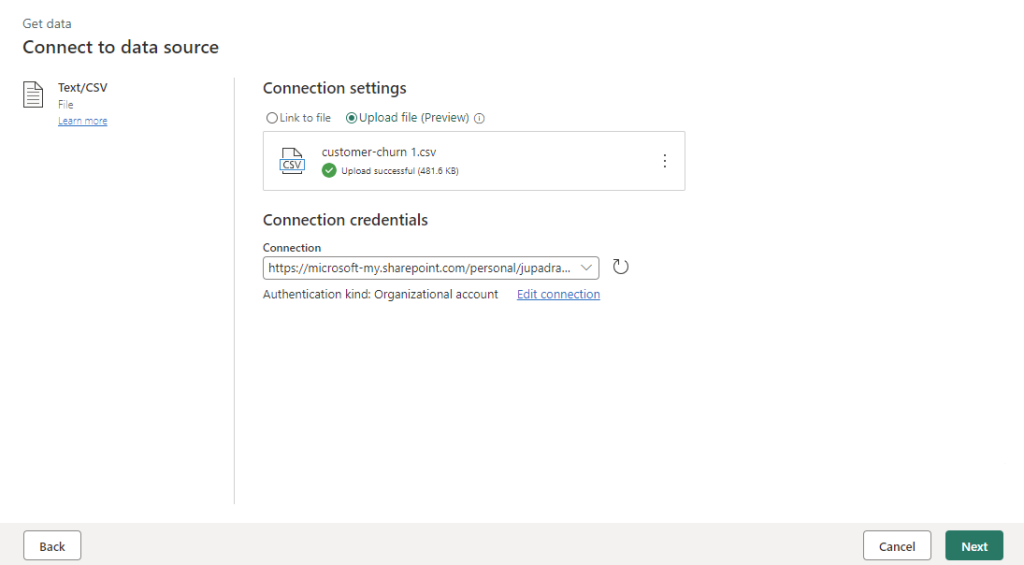
Loading different file types is a breeze, often requiring just a few steps. For example, you can easily load a text or CSV file from your local computer.

Transforming Data
After importing your data, you can begin authoring your dataflow. This might involve cleaning, reshaping, removing columns, and creating new ones. All the transformations you apply are meticulously saved.
Transform Data with Copilot
Copilot can be a valuable assistant in your dataflow transformations. Let’s say you have a Gender column containing ‘Male’ and ‘Female’ values that you want to transform.
- Activate Copilot within your dataflow.
- Provide specific instructions for the desired transformation. For instance, you could input: “Transform the Gender column. If Male 0, if Female 1. Then convert it to integer.”

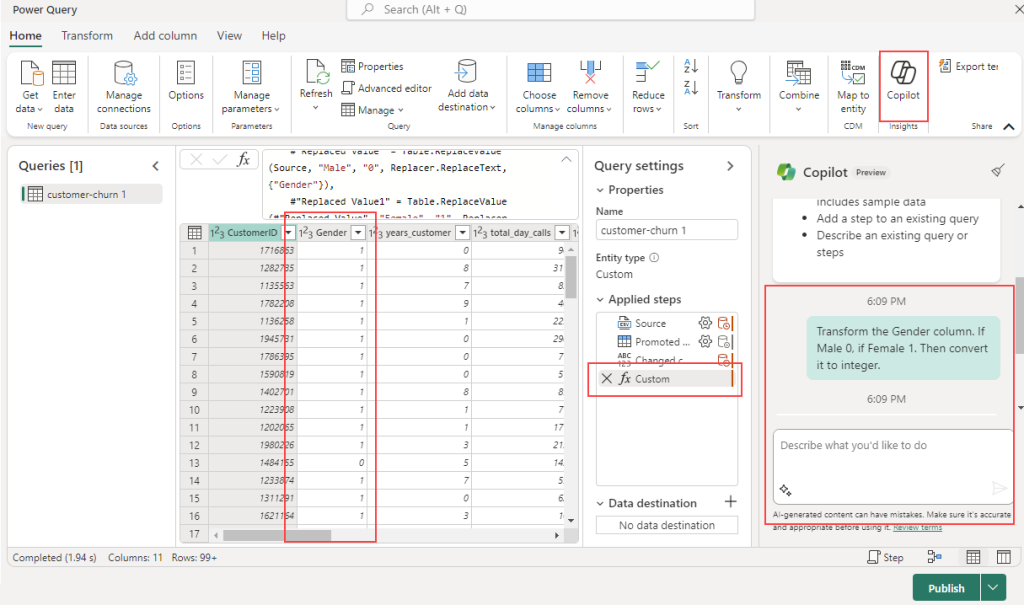
Copilot will automatically add a new step to your dataflow, which you can always revert or build upon for further transformations.
Adding a Data Destination
The Add data destination feature allows you to decouple your ETL logic from the destination storage. This separation leads to cleaner, more maintainable code and simplifies modifications to either the ETL process or the storage configuration without impacting the other.
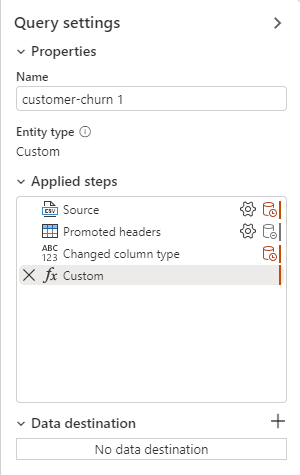
Once your data is transformed, add a destination step. In the Query settings tab, select + to add a destination to your dataflow.

The following destination options are available:
- Azure SQL Database
- Lakehouse
- Azure Data Explorer (Kusto)
- Azure Synapse Analytics (SQL DW)
- Warehouse
Data loaded into a destination like a warehouse becomes readily accessible for analysis using various tools, enhancing data accessibility and enabling more flexible and comprehensive analysis.
When selecting a warehouse as your destination, you can choose between the following update methods:

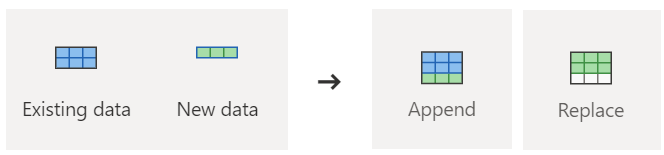
- Append: Add new rows to an existing table.
- Replace: Replace the entire table content with new data.
Publishing a Dataflow
After choosing your update method, the final step is to publish your dataflow.
Publishing activates your transformations and data loading operations, allowing the dataflow to be executed either manually or on a schedule. This process encapsulates your ETL operations into a reusable unit, streamlining your data management workflow.
Remember: Any changes you make within the dataflow only take effect after it’s published. Always ensure to publish your dataflow after making any relevant modifications.
Summary
No One-Size-Fits-All
When it comes to loading data into your data warehouse, there’s no single solution that works for every scenario. The optimal approach hinges on the specific needs of your business and the questions you’re trying to answer with your data.
Key Considerations for Data Warehouse Loading
Several factors should be carefully evaluated when loading data into a data warehouse:
| Consideration | Description |
|---|---|
| Load Volume & Frequency | Assess the volume of data and the frequency of loads to optimize performance and resource utilization. |
| Governance | All data landing in OneLake is automatically governed by default, ensuring data security and compliance. |
| Data Mapping | Manage the mapping of data from its source to staging tables and finally to the data warehouse for consistency and accuracy. |
| Dependencies | Understand the dependencies within your data model to ensure proper loading order, especially for dimension tables. |
| Script Design | Craft efficient import scripts, considering column names, filtering rules, value mapping, and database indexing. |
Further Reading
For a deeper dive into data warehousing in Microsoft Fabric, you can explore the following resources:
- Create a Warehouse in Microsoft Fabric
- Ingest data into the Warehouse
- Compare the Warehouse and the SQL analytics endpoint of the Lakehouse
This blog post is based on information and concepts derived from the Microsoft Learn module titled “Load data into a Microsoft Fabric data warehouse.” The original content can be found here:
https://learn.microsoft.com/en-us/training/modules/load-data-into-microsoft-fabric-data-warehouse/
Deixe um comentário Cancelar resposta